import pandas as pd
import numpy as np
import matplotlib.pyplot as plt

dataset = pd.read_csv('_data/02-data.csv')

x = dataset.iloc[:, :-1].values
y = dataset.iloc[:, -1].values

from sklearn.model_selection import train_test_split

X_train, X_test, y_train, y_test = train_test_split(x, y, test_size=0.2)Simple Linear Regression
machine learning

preprocessing
train
from sklearn.linear_model import LinearRegression

regressor = LinearRegression()
regressor.fit(X_train, y_train)LinearRegression()In a Jupyter environment, please rerun this cell to show the HTML representation or trust the notebook.
On GitHub, the HTML representation is unable to render, please try loading this page with nbviewer.org.
LinearRegression()
predict
y_pred = regressor.predict(X_test)visualize
plt.scatter(X_train, y_train, color='red')
plt.plot(X_train, regressor.predict(X_train), color='blue')
plt.title('Salary vs Experience (training set)')
plt.xlabel('Years of Experience')
plt.ylabel('Salary')
plt.show()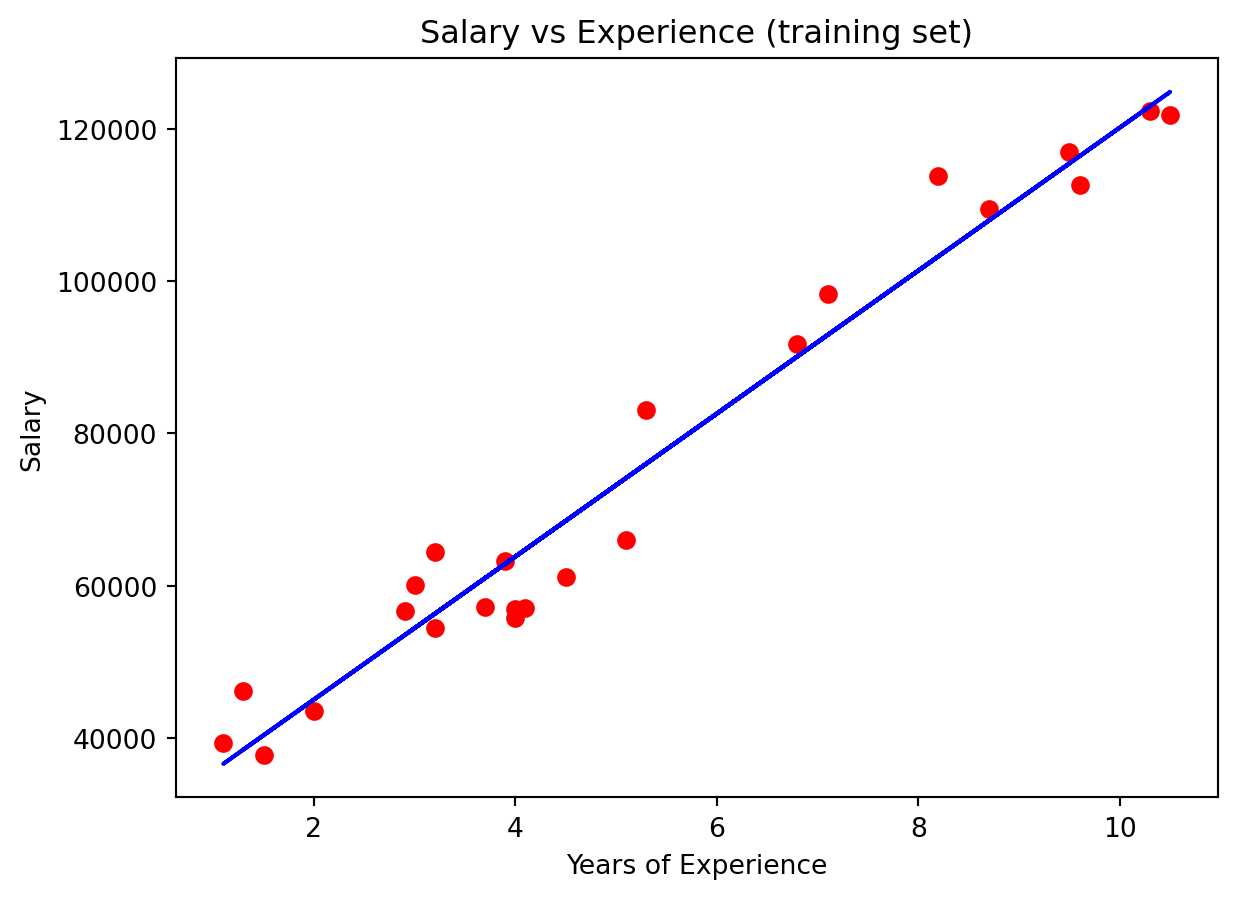
plt.scatter(X_test, y_test, color='red')
plt.plot(X_train, regressor.predict(X_train), color='blue')
plt.title('Salary vs Experience (test set)')
plt.xlabel('Years of Experience')
plt.ylabel('Salary')
plt.show()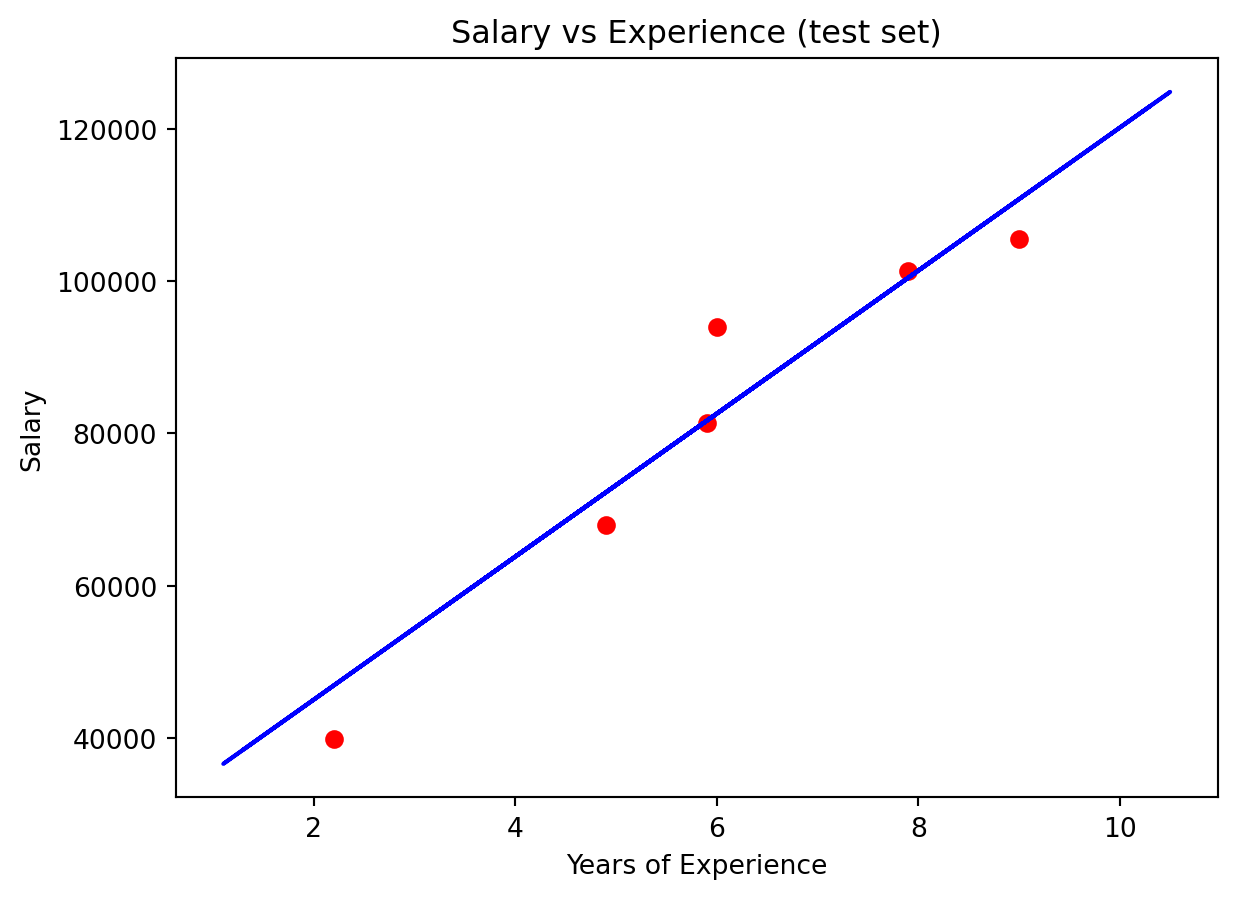
evaluate
from sklearn.metrics import r2_score

r2_score(y_test, y_pred)
0.9261621443754907