import pandas as pd
import numpy as np
import matplotlib.pyplot as plt

dataset = pd.read_csv('_data/04.csv')
x = dataset.iloc[:, 1:-1].values
y = dataset.iloc[:, -1].values
y = y.reshape(len(y), 1)Support Vector Regression
machine learning

preprocessing
from sklearn.preprocessing import StandardScaler

sc_x = StandardScaler()
sc_y = StandardScaler()

x = sc_x.fit_transform(x)
y = sc_y.fit_transform(y)
Train
from sklearn.svm import SVR

regressor = SVR(kernel='rbf')
regressor.fit(x, y)
/home/cryscham123/.local/lib/python3.12/site-packages/sklearn/utils/validation.py:1339: DataConversionWarning:
A column-vector y was passed when a 1d array was expected. Please change the shape of y to (n_samples, ), for example using ravel().
SVR()In a Jupyter environment, please rerun this cell to show the HTML representation or trust the notebook.
On GitHub, the HTML representation is unable to render, please try loading this page with nbviewer.org.
SVR()
Visualize
plt.scatter(sc_x.inverse_transform(x), sc_y.inverse_transform(y), color='red')
plt.plot(sc_x.inverse_transform(x), sc_y.inverse_transform(regressor.predict(x).reshape(-1, 1)))
plt.show()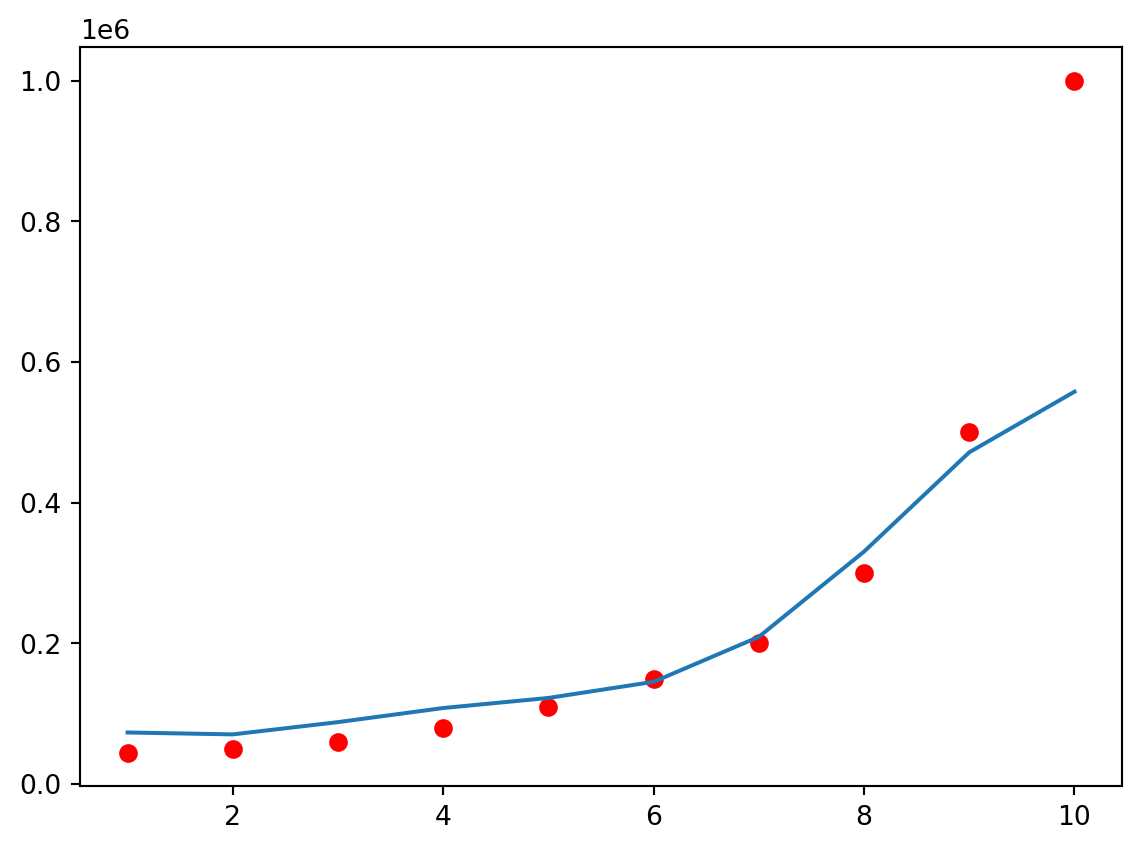
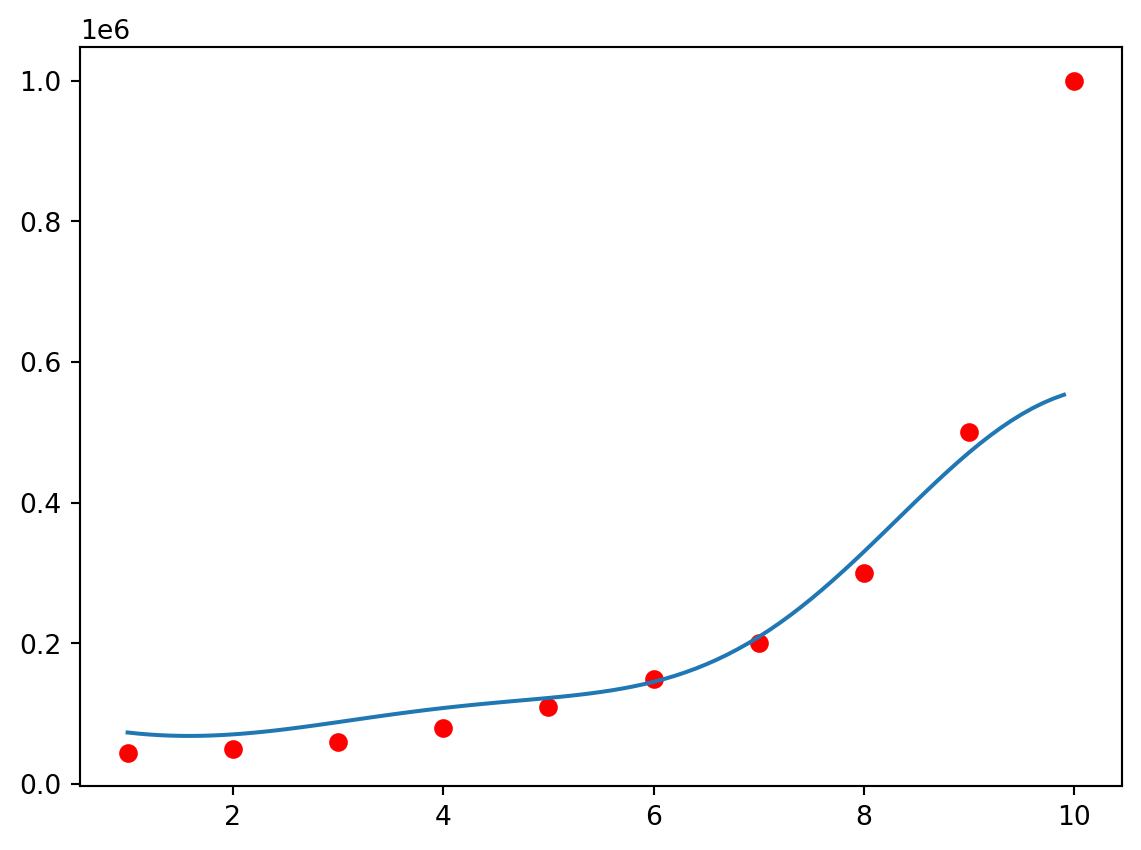
High resolution
x_grid = np.arange(min(sc_x.inverse_transform(x)), max(sc_x.inverse_transform(x)), 0.1)
x_grid = x_grid.reshape((len(x_grid), 1))
plt.scatter(sc_x.inverse_transform(x), sc_y.inverse_transform(y), color='red')
plt.plot(x_grid, sc_y.inverse_transform(regressor.predict(sc_x.transform(x_grid)).reshape(-1, 1)))
plt.show()
/tmp/ipykernel_12503/1939094151.py:1: DeprecationWarning:
Conversion of an array with ndim > 0 to a scalar is deprecated, and will error in future. Ensure you extract a single element from your array before performing this operation. (Deprecated NumPy 1.25.)