import pandas as pd
import numpy as np
import matplotlib.pyplot as plt
import warnings

warnings.filterwarnings('ignore')

dataset = pd.read_csv('_data/04.csv')
x = dataset.iloc[:, 1:-1].values
y = dataset.iloc[:, -1].valuesrandom forest
machine learning

Preprocessing
Modeling
from sklearn.ensemble import RandomForestRegressor

regressor = RandomForestRegressor(n_estimators=10, random_state=0)

# 모델 학습
regressor.fit(x, y)
RandomForestRegressor(n_estimators=10, random_state=0)In a Jupyter environment, please rerun this cell to show the HTML representation or trust the notebook.
On GitHub, the HTML representation is unable to render, please try loading this page with nbviewer.org.
RandomForestRegressor(n_estimators=10, random_state=0)
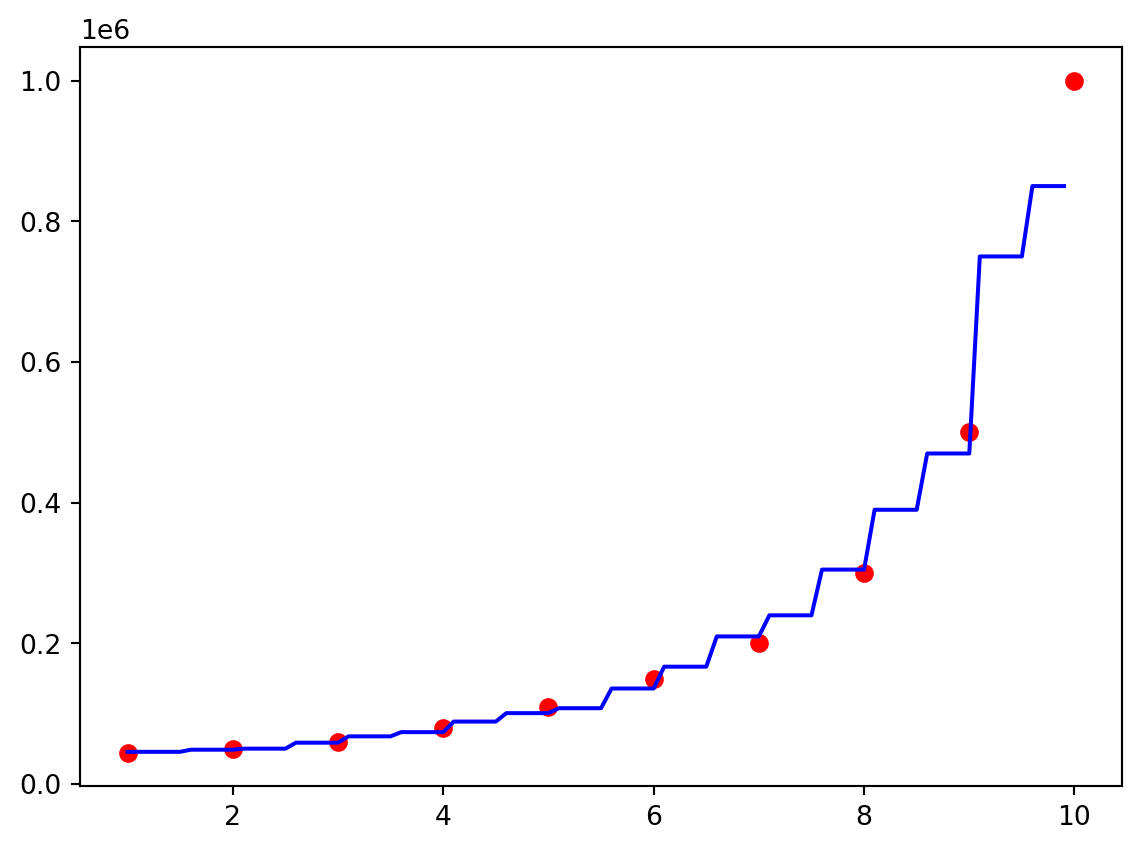
Visualization
x_grid = np.arange(min(x), max(x), 0.1)
x_grid = x_grid.reshape((len(x_grid), 1))
plt.scatter(x, y, color='red')
plt.plot(x_grid, regressor.predict(x_grid), color='blue')
plt.show()