import pandas as pd
import numpy as np
import matplotlib.pyplot as plt
import warnings

warnings.filterwarnings('ignore')

dataset = pd.read_csv('_data/14.csv')
x = dataset.iloc[:, [3, 4]].valueshierarchical clustering
machine learning

preprocessing
Modeling
import scipy.cluster.hierarchy as sch

dendogram = sch.dendrogram(sch.linkage(x, method='ward'))
plt.title('dendogram')
plt.xlabel('Customers')
plt.ylabel('Distance')
plt.show()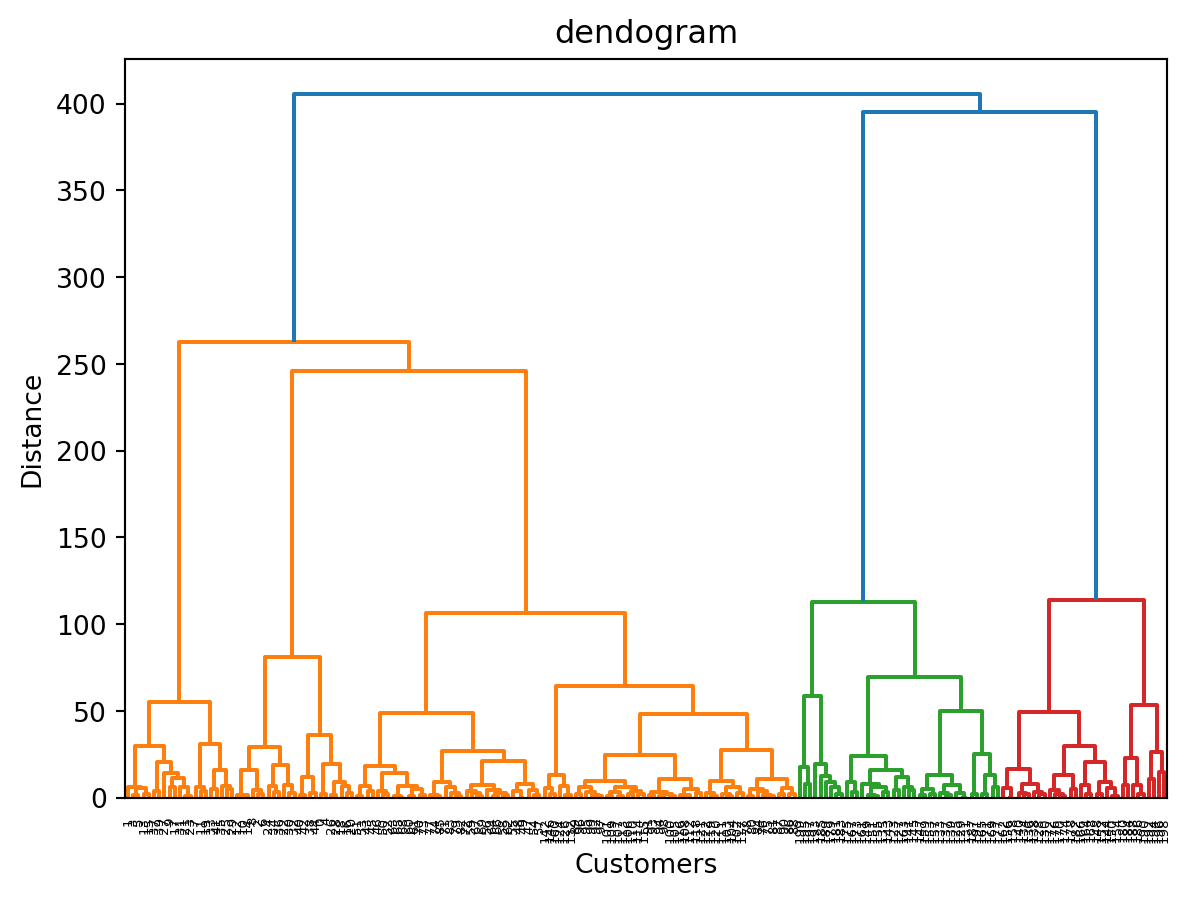
from sklearn.cluster import AgglomerativeClustering
hc = AgglomerativeClustering(n_clusters=5, metric='euclidean', linkage='ward')
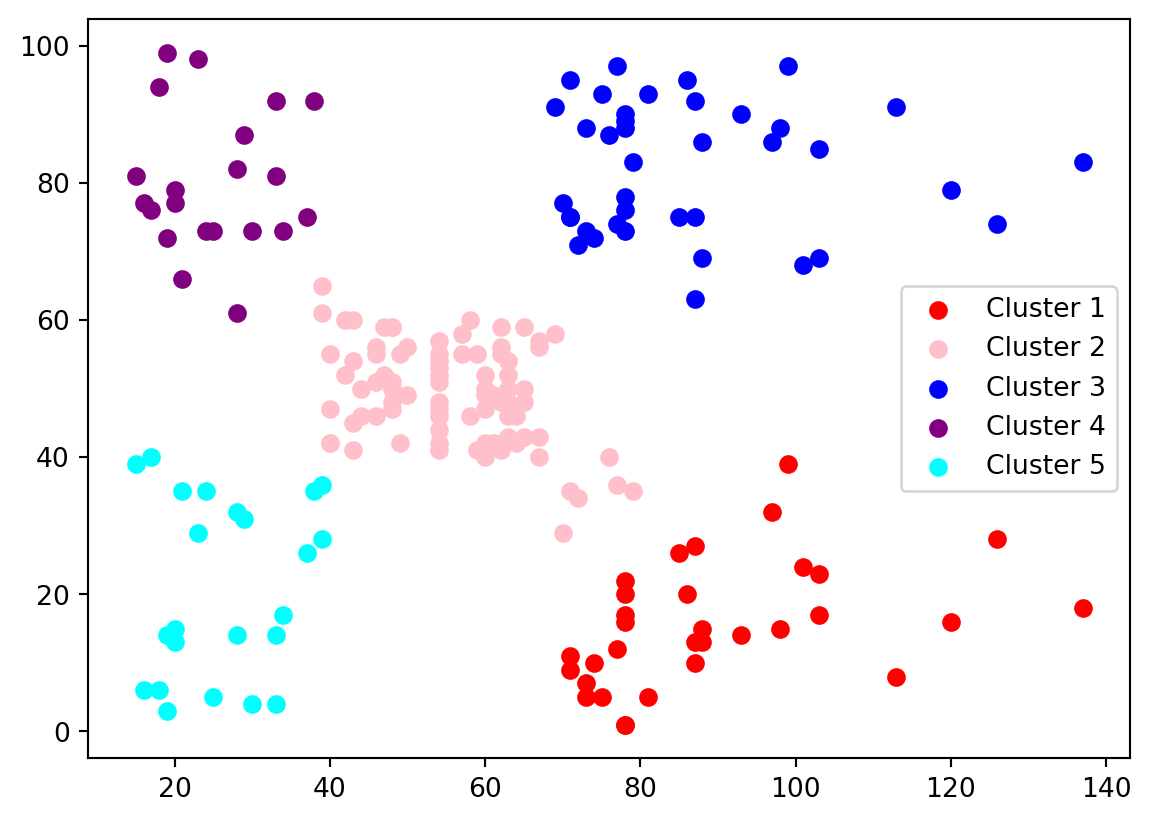
yh = hc.fit_predict(x)Visualize
plt.scatter(x[yh == 0, 0], x[yh == 0, 1], c='red', label='Cluster 1')
plt.scatter(x[yh == 1, 0], x[yh == 1, 1], c='pink', label='Cluster 2')
plt.scatter(x[yh == 2, 0], x[yh == 2, 1], c='blue', label='Cluster 3')
plt.scatter(x[yh == 3, 0], x[yh == 3, 1], c='purple', label='Cluster 4')
plt.scatter(x[yh == 4, 0], x[yh == 4, 1], c='cyan', label='Cluster 5')
plt.legend()
plt.show()