import numpy as np
import pandas as pd
import matplotlib.pyplot as plt
from seaborn import color_palette
df = pd.DataFrame(range(1, 11)).sample(100, replace=True)
table = pd.crosstab(index=df.values.flatten(), colnames=['질병'], columns='도수')
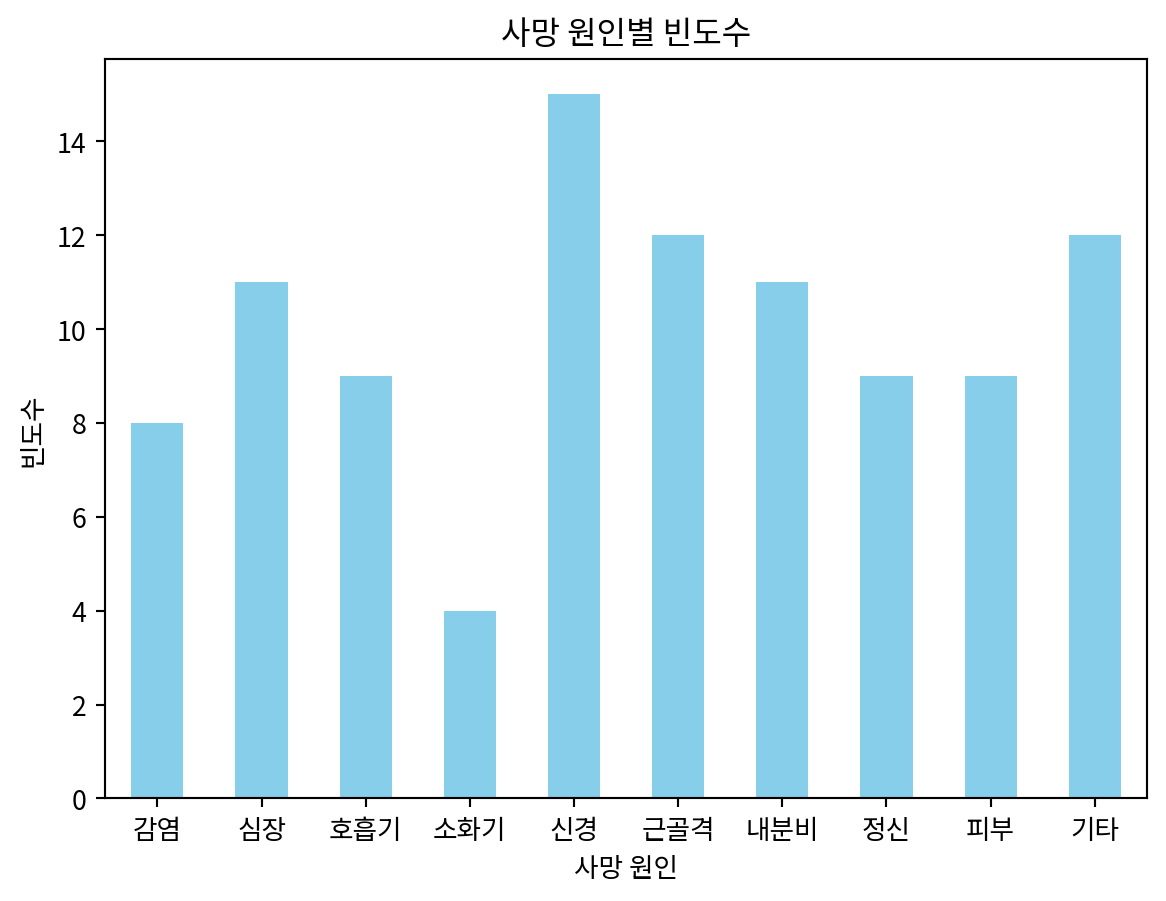
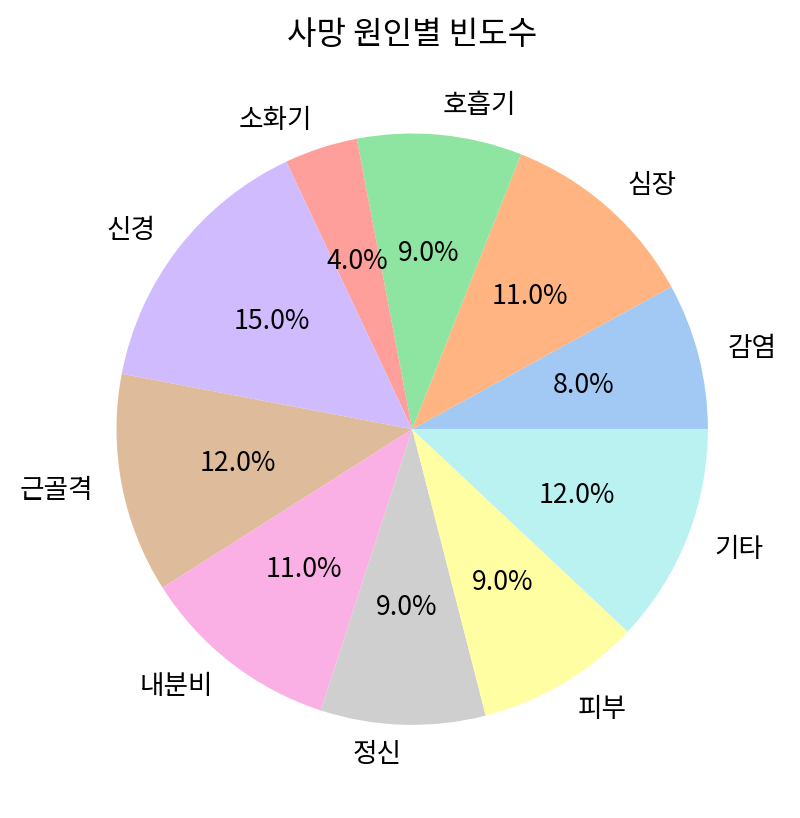
table.index = ["감염", "심장", "호흡기", "소화기", "신경", "근골격", "내분비", "정신", "피부", "기타"]
print(table)질병 도수
감염 8
심장 11
호흡기 9
소화기 4
신경 15
근골격 12
내분비 11
정신 9
피부 9
기타 12