import statsmodels.api as sm
import pandas as pd
import numpy as np
import matplotlib.pyplot as plt
import seaborn as sns
plt.rcParams['font.family'] = 'Noto Sans KR'
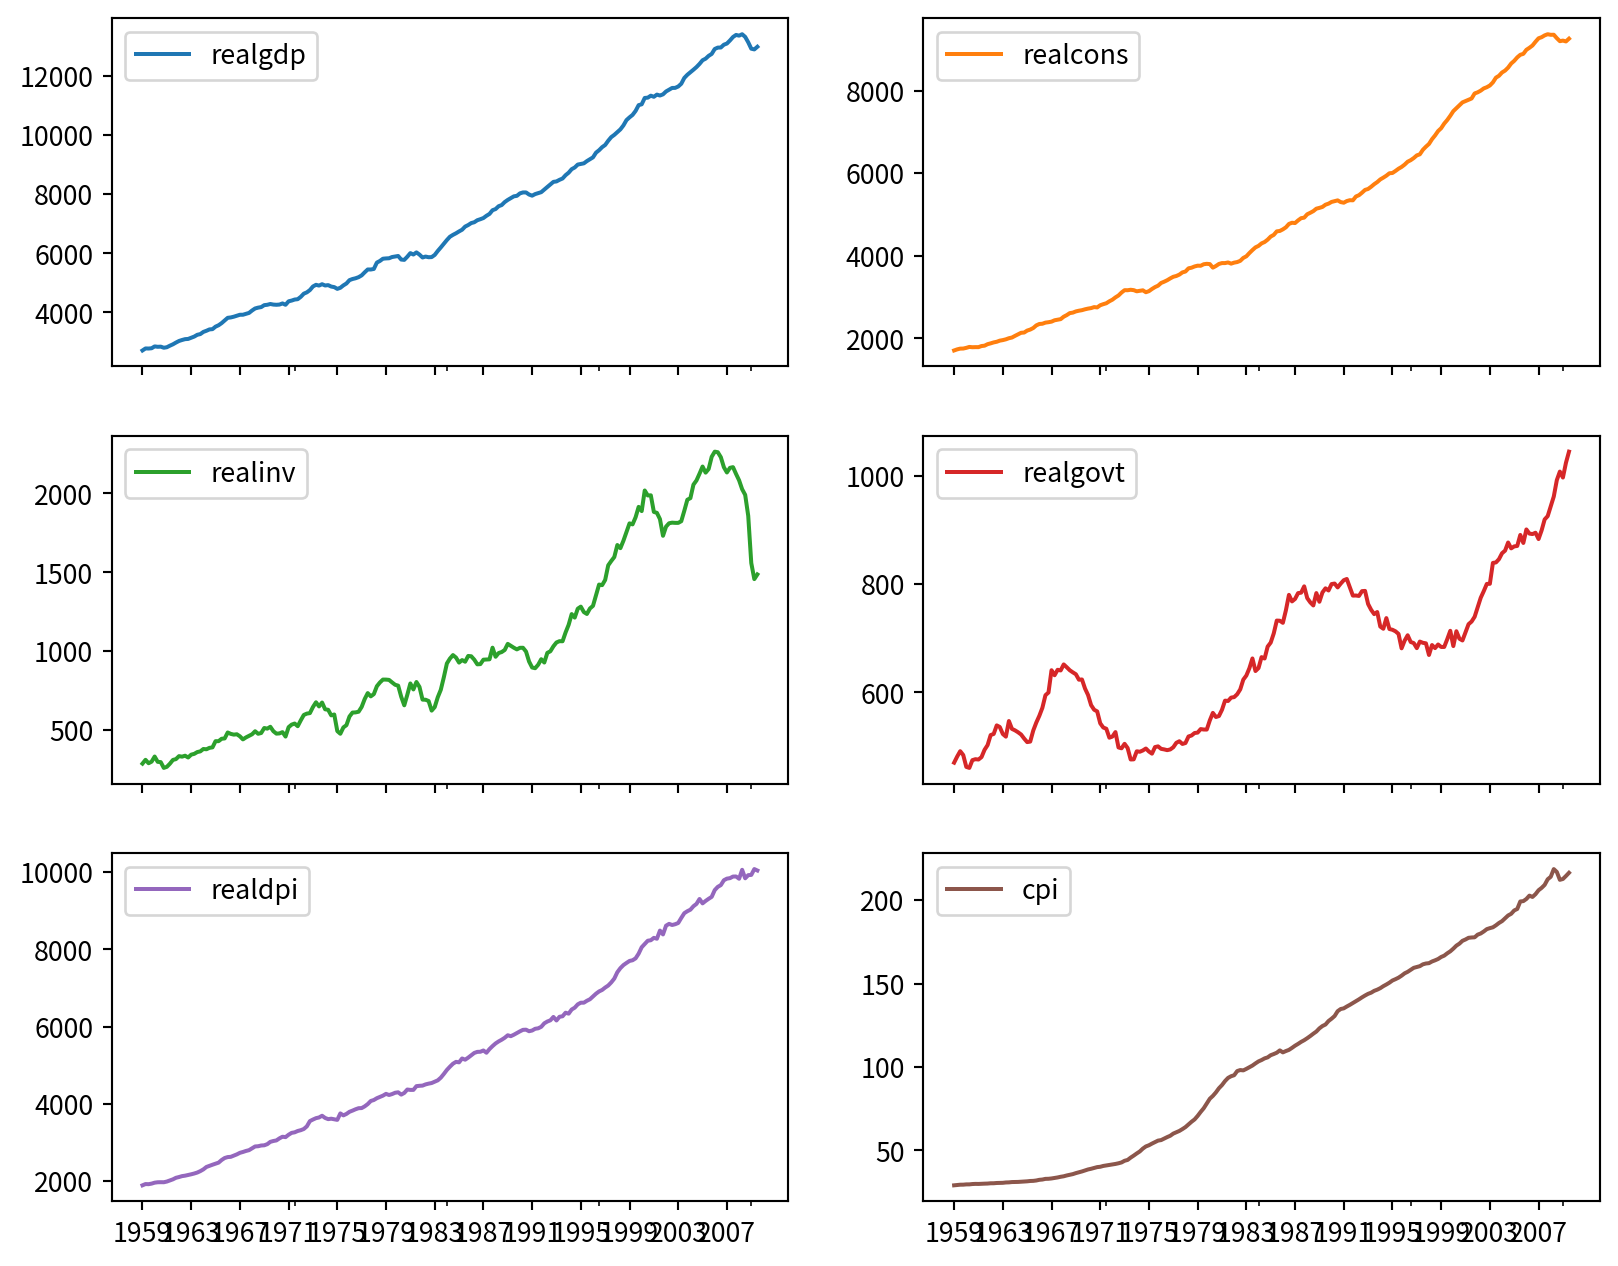
macro_econ_data = sm.datasets.macrodata.load_pandas().data
macro_econ_data| year | quarter | realgdp | realcons | realinv | realgovt | realdpi | cpi | m1 | tbilrate | unemp | pop | infl | realint | |
|---|---|---|---|---|---|---|---|---|---|---|---|---|---|---|
| 0 | 1959.0 | 1.0 | 2710.349 | 1707.4 | 286.898 | 470.045 | 1886.9 | 28.980 | 139.7 | 2.82 | 5.8 | 177.146 | 0.00 | 0.00 |
| 1 | 1959.0 | 2.0 | 2778.801 | 1733.7 | 310.859 | 481.301 | 1919.7 | 29.150 | 141.7 | 3.08 | 5.1 | 177.830 | 2.34 | 0.74 |
| 2 | 1959.0 | 3.0 | 2775.488 | 1751.8 | 289.226 | 491.260 | 1916.4 | 29.350 | 140.5 | 3.82 | 5.3 | 178.657 | 2.74 | 1.09 |
| 3 | 1959.0 | 4.0 | 2785.204 | 1753.7 | 299.356 | 484.052 | 1931.3 | 29.370 | 140.0 | 4.33 | 5.6 | 179.386 | 0.27 | 4.06 |
| 4 | 1960.0 | 1.0 | 2847.699 | 1770.5 | 331.722 | 462.199 | 1955.5 | 29.540 | 139.6 | 3.50 | 5.2 | 180.007 | 2.31 | 1.19 |
| ... | ... | ... | ... | ... | ... | ... | ... | ... | ... | ... | ... | ... | ... | ... |
| 198 | 2008.0 | 3.0 | 13324.600 | 9267.7 | 1990.693 | 991.551 | 9838.3 | 216.889 | 1474.7 | 1.17 | 6.0 | 305.270 | -3.16 | 4.33 |
| 199 | 2008.0 | 4.0 | 13141.920 | 9195.3 | 1857.661 | 1007.273 | 9920.4 | 212.174 | 1576.5 | 0.12 | 6.9 | 305.952 | -8.79 | 8.91 |
| 200 | 2009.0 | 1.0 | 12925.410 | 9209.2 | 1558.494 | 996.287 | 9926.4 | 212.671 | 1592.8 | 0.22 | 8.1 | 306.547 | 0.94 | -0.71 |
| 201 | 2009.0 | 2.0 | 12901.504 | 9189.0 | 1456.678 | 1023.528 | 10077.5 | 214.469 | 1653.6 | 0.18 | 9.2 | 307.226 | 3.37 | -3.19 |
| 202 | 2009.0 | 3.0 | 12990.341 | 9256.0 | 1486.398 | 1044.088 | 10040.6 | 216.385 | 1673.9 | 0.12 | 9.6 | 308.013 | 3.56 | -3.44 |
203 rows × 14 columns