import numpy as np
from scipy.stats import norm
from empiricaldist import Pmf

mean = 178
std = 7.7

qs = np.arange(mean-24, mean+24, 0.5)
ps = norm(mean, std).pdf(qs)
prior = Pmf(ps, qs)
prior.normalize()
1.9963309462450582
import numpy as np
from scipy.stats import norm
from empiricaldist import Pmf
mean = 178
std = 7.7
qs = np.arange(mean-24, mean+24, 0.5)
ps = norm(mean, std).pdf(qs)
prior = Pmf(ps, qs)
prior.normalize()1.9963309462450582import pandas as pd
def make_joint(pmf1, pmf2):
X, Y = np.meshgrid(pmf1, pmf2)
return pd.DataFrame(X * Y, columns=pmf1.qs, index=pmf2.qs)import matplotlib.pyplot as plt
plt.rcParams['font.family'] = 'Noto Sans KR'
joint = make_joint(prior, prior)
plt.contour(joint.columns, joint.index, joint, linewidths=2)
plt.xlabel('A의 키(cm)')
plt.ylabel('B의 키(cm)')Text(0, 0.5, 'B의 키(cm)')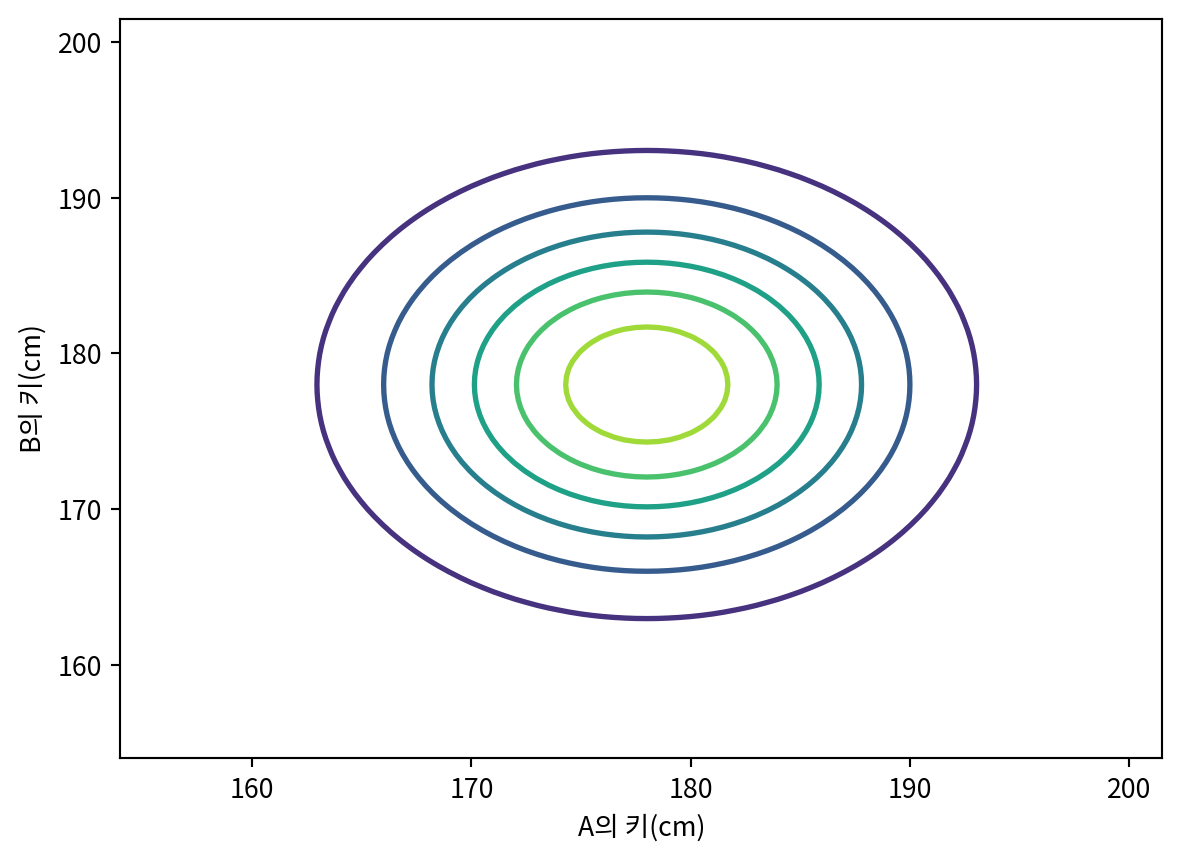
x, y = joint.columns, joint.index
X, Y = np.meshgrid(x, y)
a = np.where((X > Y), 1, 0)
likelihood = pd.DataFrame(a, index=x, columns=y)
posterior = joint * likelihood
def normalize(pdf):
prob_data = joint.to_numpy().sum()
pdf /= prob_data
return prob_data
normalize(posterior)
marginal_A = Pmf(posterior.sum(axis=0))
marginal_B = Pmf(posterior.sum(axis=1))
marginal_A.normalize()
marginal_B.normalize()
marginal_A.plot()
marginal_B.plot()
prior.plot()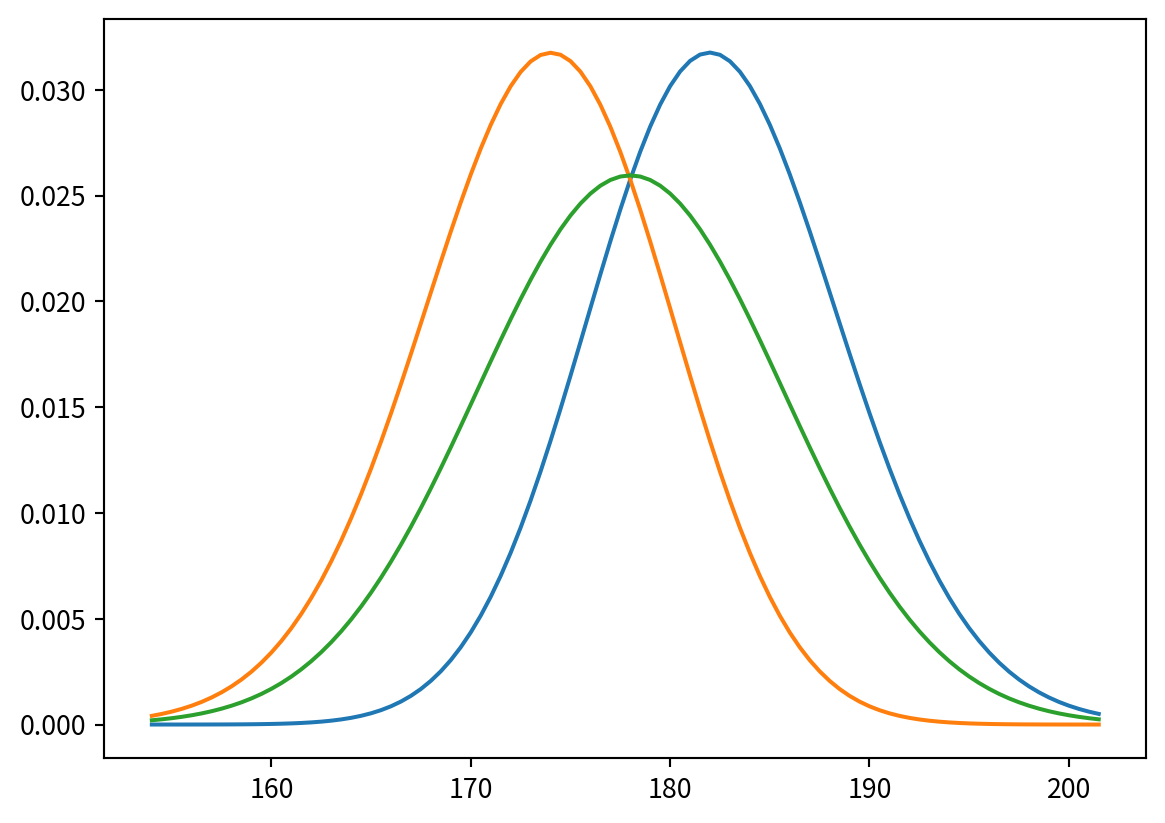
marginal_A.mean(), marginal_B.mean()(182.38728123421686, 173.60286000233393)pmf = Pmf(posterior[170])
pmf.normalize()
pmf.plot()
pmf = Pmf(posterior.loc[180])
pmf.normalize()
pmf.plot()
mean = 163
std = 7.3
qs = np.arange(mean-24, mean+24, 0.5)
ps = norm(mean, std).pdf(qs)
girl_prior = Pmf(ps, qs)
girl_prior.normalize()
joint = make_joint(marginal_A, girl_prior)

x, y = joint.columns, joint.index
X, Y = np.meshgrid(x, y)
a = np.where((X - Y >= 15), 1, 0)
likelihood = pd.DataFrame(a, index=y, columns=x)
posterior = joint * likelihood
normalize(posterior)
marginal_A.plot(label='c 정보 이전')
marginal_A = Pmf(posterior.sum(axis=0))
marginal_A.normalize()
marginal_A.plot(label='c 정보 이후')
plt.legend()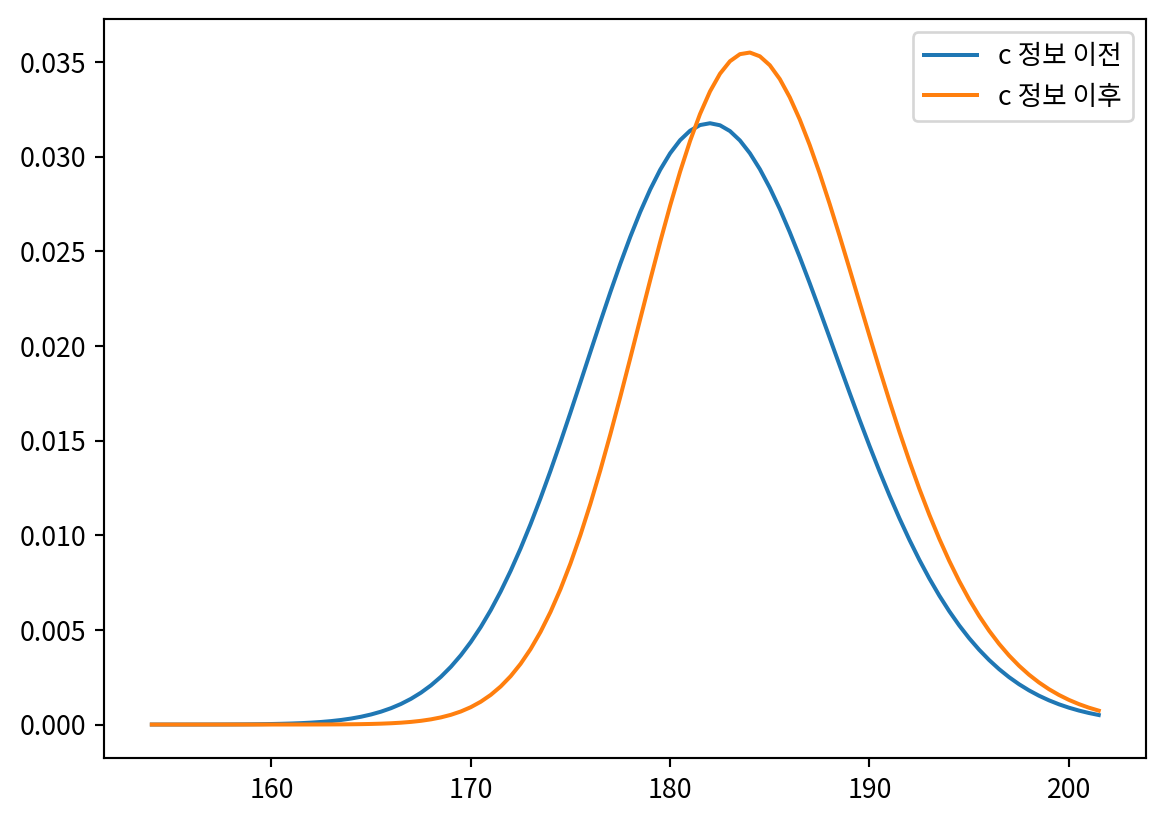
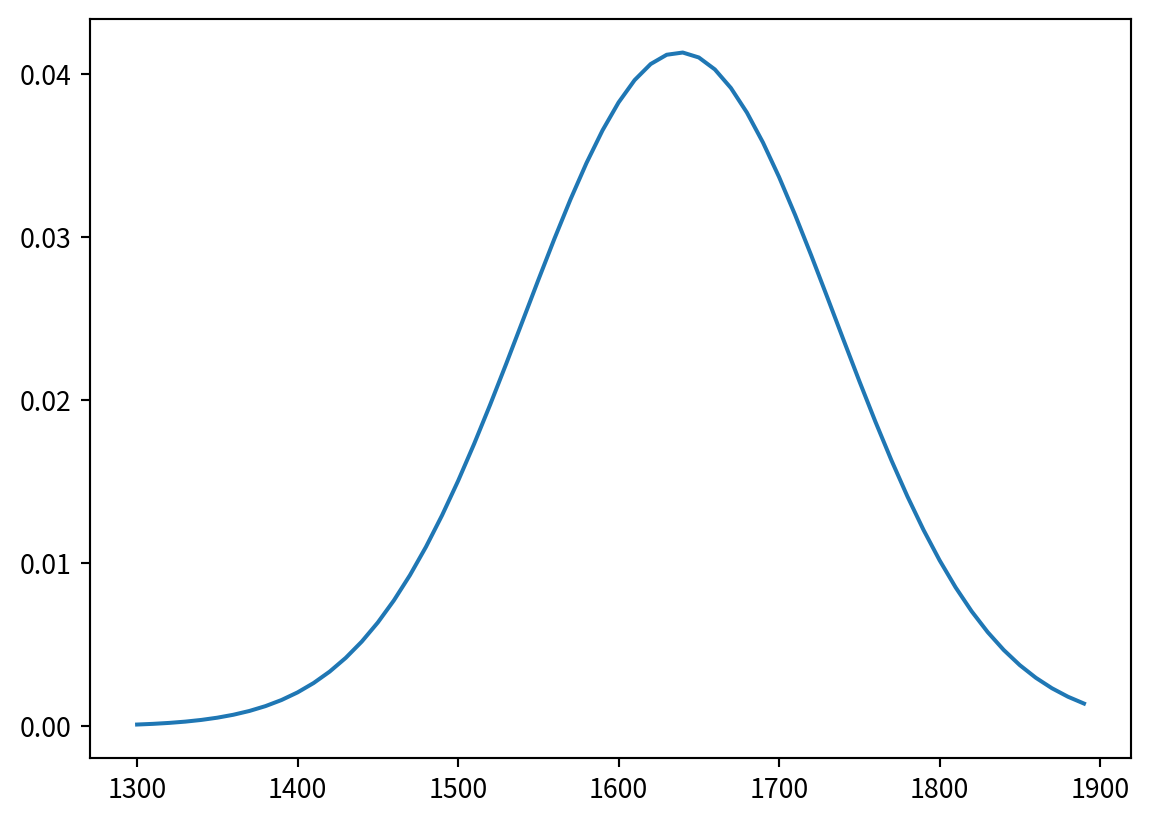
mean_A = 1600
std_A = 100
qs_A = np.arange(mean_A - 300, mean_A + 300, 10)
ps_A = norm(mean_A, std_A).pdf(qs_A)
prior_A = Pmf(ps_A, qs_A)
prior_A.normalize()

mean_B = 1800
std_B = 100
qs_B = np.arange(mean_B - 300, mean_B + 300, 10)
ps_B = norm(mean_B, std_B).pdf(qs_B)
prior_B = Pmf(ps_B, qs_B)
prior_B.normalize()

joint = make_joint(prior_A, prior_B)
def logistic_prob(r_a, r_b):
return 1 / (1 + 10**((r_b - r_a) / 400))
x, y = joint.columns, joint.index
X, Y = np.meshgrid(x, y)
a = 1 / (1 + 10**((Y - X) / 400))
likelihood = pd.DataFrame(a, index=y, columns=x)
posterior = joint * likelihood
normalize(posterior)
marginal_A = Pmf(posterior.sum(axis=0))
marginal_A.normalize()
print(marginal_A.max_prob(), marginal_A.mean())
marginal_A.plot()1640 1636.648345528236